In Spring 2021, the Learning Analytics DiaLOG group is piloting My Learning Analytics (MyLA), a dashboard developed at the University of Michigan that provides students with information about their engagement with course resources, assignments, and grades in a Canvas course. The goal of the pilot is to gather data about the student and faculty experience in order to inform future learning analytics projects and pilots. MyLA makes available three learning analytics data visualizations:
- Resources Accessed: Students can see which files are popular in the course and accessed most often by classmates. Files are color-coded in blue if the student has accessed them or gray if they have not. File names have active links to immediately open resources they have missed.
- Assignment Planning: Students can view their progress and upcoming assignment in two different ways: Progress to Final Grade or Assignments Due by Date.
- Grade Distribution: This visualization provides a bar chart that shows the distribution of grades in the class along with the number of students in the class, as well as the average and median grades. This visualization has been designed to address student privacy by binning low outlier grades.
These visualizations can be accessed directly from the course navigation menu in Canvas.
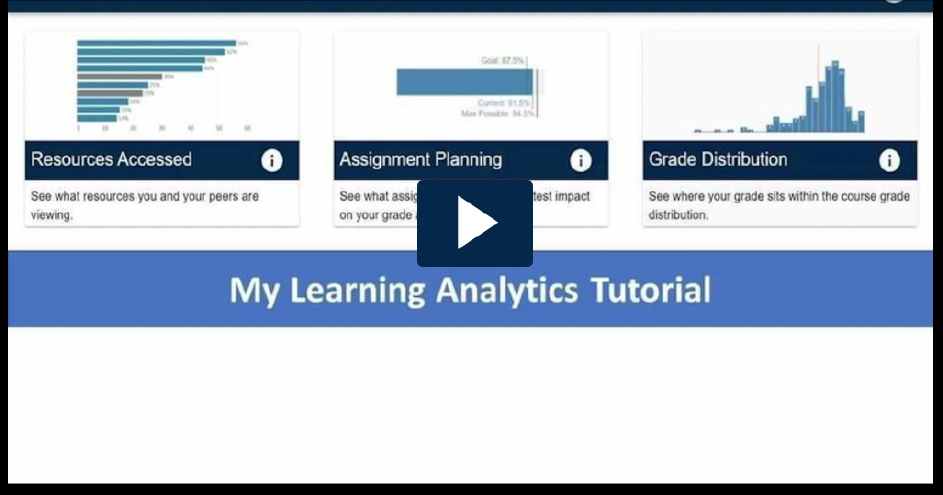
MyLA Tutorial Video
Additional Resources
- Please visit the MyLA Pilot: Faculty Information page for more information on faculty participation.
- Visit the My Learning Analytics for Students webpage to see the information that we're sharing with student participants.